
Insight · October 26, 2026
Northeast Florida Home Prices Fell 5% and Rose 1%. Both Headlines Are True.
Confused by home price headlines? Jacksonville REALTOR Erin King breaks down September 2026 Northeast Florida data county by county and explains what it means for buyers and sellers.
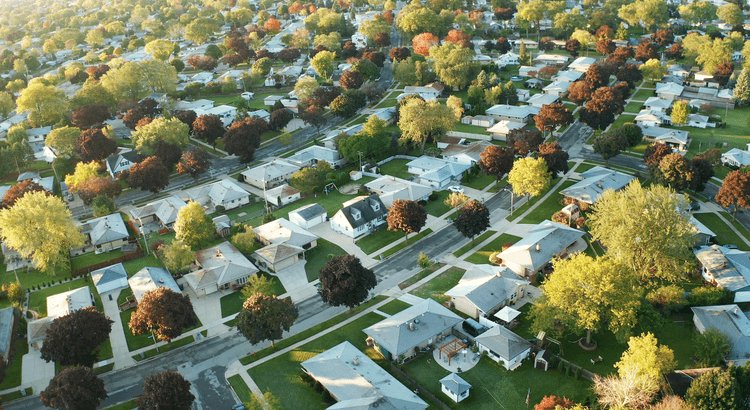
If housing headlines have left you more confused than informed, here's why. The median single-family price across Northeast Florida dropped from $420,000 in June to $399,000 in September, a slide of about 5%. Over the same stretch, that median rose 1.1% from August to September. Same market, same season, two accurate headlines pointing in opposite directions.
The answer to "what are home prices doing?" depends on three things: the time frame being measured, the place being measured, and the kind of home being measured. National headlines compress all three into a single number. Your decision happens on one street.
Why Do Home Prices Dip Every Fall?
Summer is the busiest season in real estate. Families time moves around the school calendar, more buyers are shopping, and prices tend to peak. Once school starts, the buyer pool thins out, and the sellers still on the market price to meet the buyers who remain.
You can see it in the September numbers. In Duval County, homes took a median of 29 days to sell, up 16% from August. Across the six-county region, closed sales fell 9.5% from the month before. Some of that is the season, which repeats every year. Some of it is the mix of homes that happened to close, and some is buyers adjusting to today's borrowing costs. A median moves when any of the three moves.
If you're selling this fall, consider pricing to September's buyer. June's buyer has already moved in.
Is the Headline Measuring Asking Prices or Sale Prices?
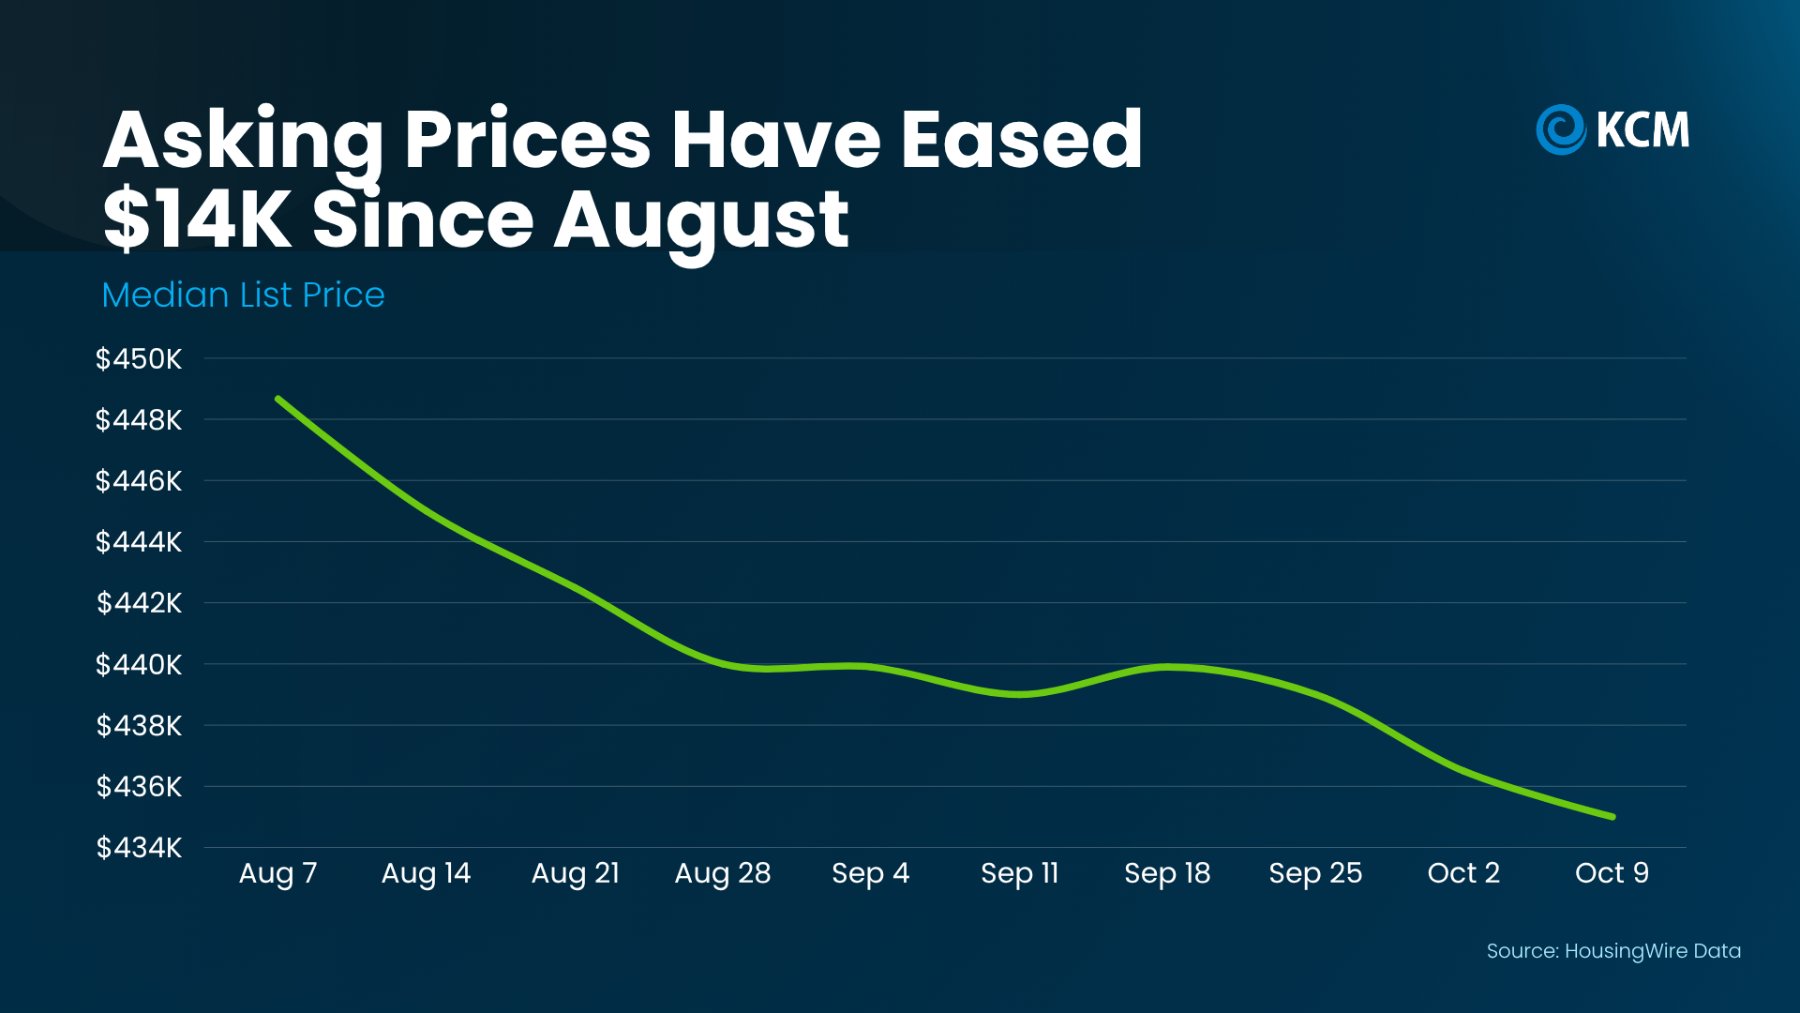
Many of the scariest headlines track asking prices. An asking price is what a seller hopes for. A sale price is what a buyer actually paid. When more sellers trim their list prices in the fall, the median asking price drops, often before sale prices move much at all.
Every local number in this post is a closed sale, the price buyers and sellers actually agreed on. The next time a headline catches your eye, check which of the two it's measuring. That one question clears up most of the confusion.
How Much Does Location Change the Picture?
More than most people expect. Here's how the counties around Jacksonville moved from August to September 2026, according to the Northeast Florida Association of REALTORS®:
Duval County's median rose 3.6% to $345,000. Clay County's fell 4.1% to $355,000. St. Johns County slipped 0.5% to $568,750, still the highest in the region. Nassau County jumped 9.3% to $496,500.
That's a swing of more than 13 percentage points between neighboring counties in a single month. Here's where a little economics helps. Monthly medians in smaller counties move with the mix of homes that happened to close. Nassau recorded 96 closed sales in September, so a handful of higher-priced closings can lift the median while the typical home's value holds steady. I treat one month as a data point and three months as a trend.
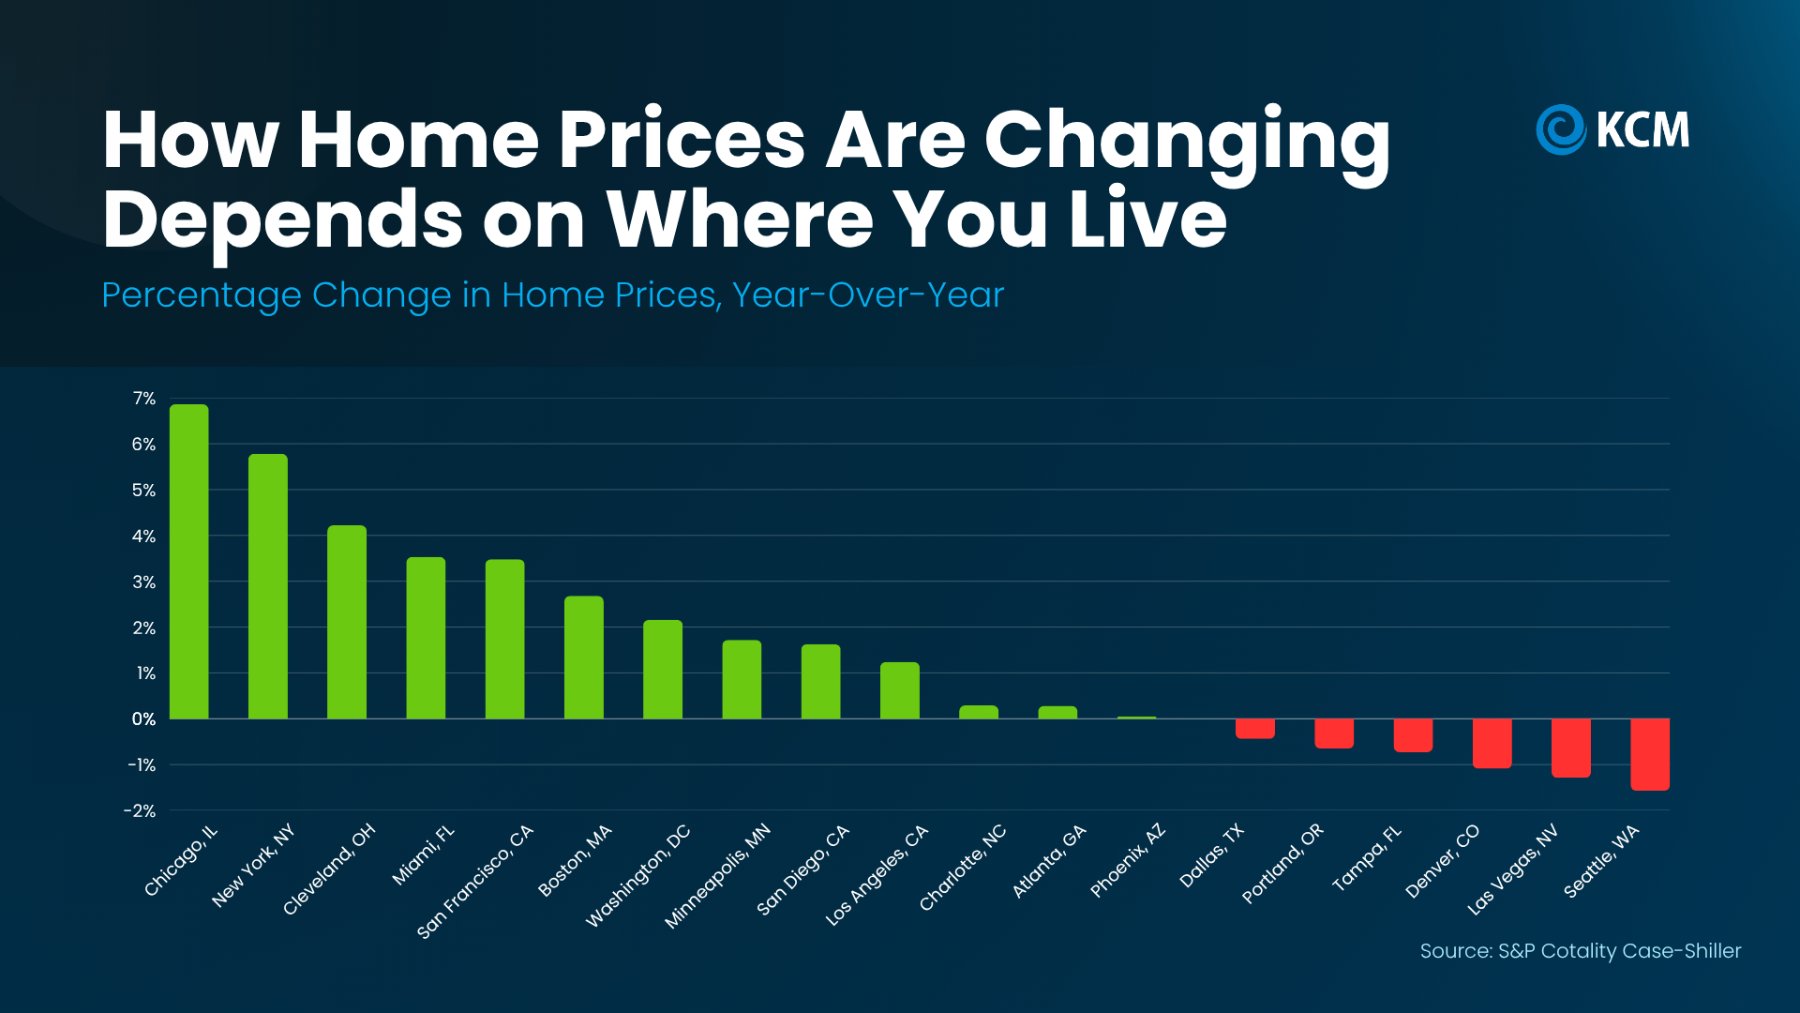
Zoom out to the state and the same pattern holds. The S&P Cotality Case-Shiller Index tracks two Florida metros. Through July 2026, Miami prices were up 3.5% over the prior year. Tampa was down 0.7%. Same state, opposite directions. Nationally, Chicago led with a 6.9% annual gain while Seattle posted a 1.6% decline, a gap of nearly 9 points.
And inside Jacksonville itself, the county median tells you even less. A 1920s home in Avondale and a newer build in the suburbs trade in separate markets, with separate inventory and separate buyers. The number that matters to you is what homes like yours, near yours, sold for in the last 90 days.
Should You Worry About a Crash?
Here's what the data shows today: sales are slowing, and prices are roughly flat to slightly up.
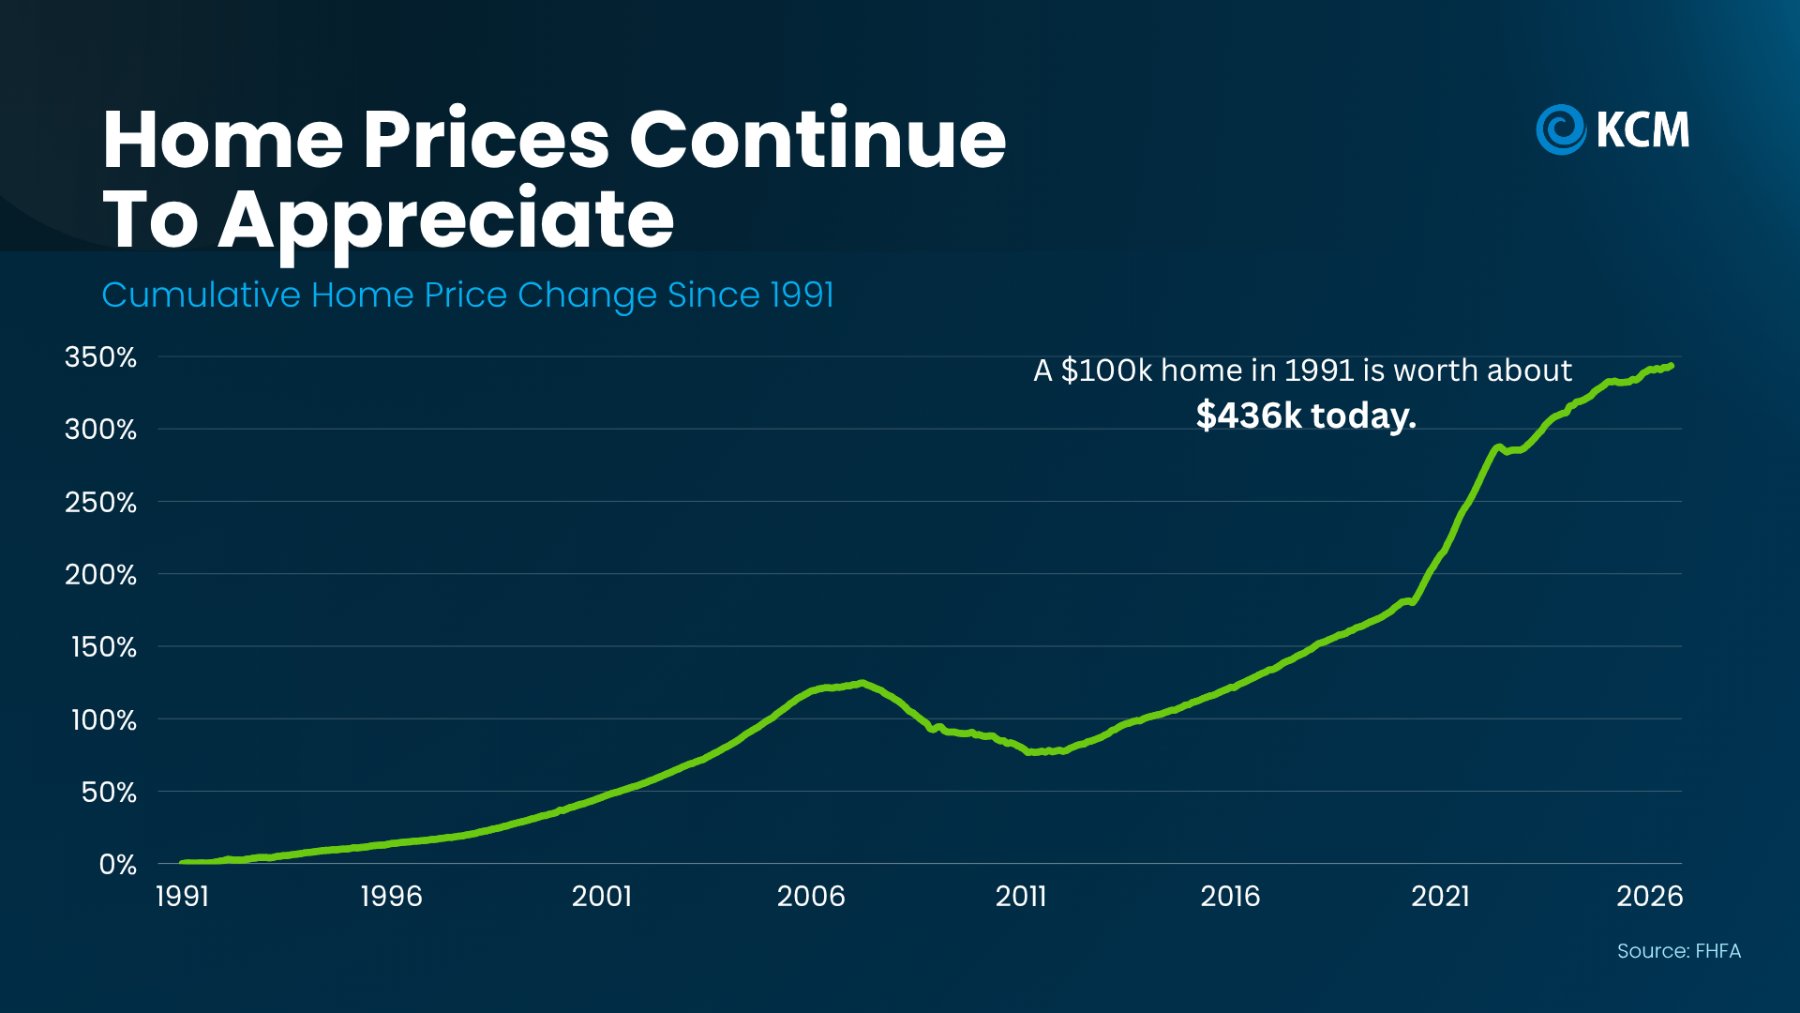
Florida's statewide median single-family sale price was $415,000 in September 2026, up 1.2% from a year earlier, and the months of supply tightened from 5.1 to 4.4. Nationally, the Case-Shiller index rose 1.9% over the year through July. The Federal Housing Finance Agency reports positive annual price appreciation every quarter since the start of 2012, and prices rose in 46 states plus the District of Columbia over the past year.
The weakest major metro in the country right now, Seattle, is down 1.6% year over year. Here at home, NEFAR's president summed up September as stable prices alongside a slower pace of sales. That describes today. The next twelve months will depend on jobs, borrowing costs, and how much inventory comes to market, which is why I'd consider reading each month's local numbers as they arrive.
What Should You Do With This Information?
If you're buying, the slower pace works in your favor. Homes sitting longer often leave more room to negotiate, especially on listings that have been on the market through a price change. Consider asking how long a home has been listed and what its price history looks like before you write an offer.
If you're selling, the headline number matters far less than the three or four homes a buyer will compare to yours. Consider pricing to the homes that have sold recently in your immediate area, and to the buyers shopping right now.
A couple of questions worth sitting with: How much of your current read on the market came from a headline written for someone in another state? And what would you decide differently if you knew exactly what the closest comparable homes sold for last month?
Bottom Line
National numbers describe the country. Your price, your offer, and your negotiating room all come from your neighborhood. If you're weighing a move, let's pull the recent sales near you and look at them together, so the decision you make rests on your own market.
About the Author
Mr. Erin E. King | MBA | CRS | REMLO
Real Estate Strategist
Coldwell Banker Vanguard Realty
3610 St. Johns Ave, Jacksonville, FL 32205
904-999-1780
NMLS: 2809997
Sources
- Northeast Florida Association of REALTORS®, September 2026 market statistics, as reported by News4JAX (Oct. 8, 2026)
- Northeast Florida Association of REALTORS®, June 2026 market statistics, as reported by News4JAX (July 10, 2026)
- Florida REALTORS®, Monthly Market Summary, September 2026, single-family homes (released Oct. 16, 2026)
- S&P Dow Jones Indices, S&P Cotality Case-Shiller Index release, data through July 2026 (Sept. 29, 2026)
- U.S. Federal Housing Finance Agency, House Price Index, Q2 2026 release (Aug. 25, 2026)

Erin E. King, MBA, CRS. Real Estate Strategist, Coldwell Banker Vanguard Realty.
Weighing a move? Send me a note or call 904-999-1780.